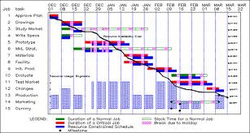
Gantt chart example
A project plan contains all activities and milestones, these tasks are placed in a particular time sequence. Some of the tools needed to assist with any project are gantt & Pert Charts. A Gantt chart displays tasks, Costs along a horizontal time scale similar to a calendar. A Gantt should show the best possible way to complete a project in the shortest possible time. These activities can be done either in parallel or sequentially, the Gantt shows this clearly, however it doesn’t show the critical path.
But a PERT (Program Evaluation and Review Technique) uses a graph to show the relationships between tasks + time frames. They are better to help identify relationships rather than progress of tasks over time.
Some Key elements of a PERT diagram:
Ø Activities ( activities within a project & their dependencies)
Ø Events ( Beginning or the end of a task)
Ø Independency of tasks
Ø Critical path ( sequence of dependent events who have the sum of longest duration)
Ø Slack time ( events not on the critical path that does not affect the timing of other tasks, these tasks can fall behind schedule that has no impact on the completion date of said project)
If you would like to create your own Gantt or PERT you can try them at the following links.
project kickstart or minuteman-systems


